Looking at the Past for Future Perspective | Bear Markets and Recoveries | June 2020
While the bear market earlier this year may have had little historical precedent given the nature of the COVID-19 pandemic, investors may find it helpful to review recent market developments against past bear markets and subsequent recoveries to gain insights and longer-term perspective.
Why do bear markets occur? What is a ‘bear market’?
A bear market is commonly defined as a peak-to-trough decline of more than 20 percent.
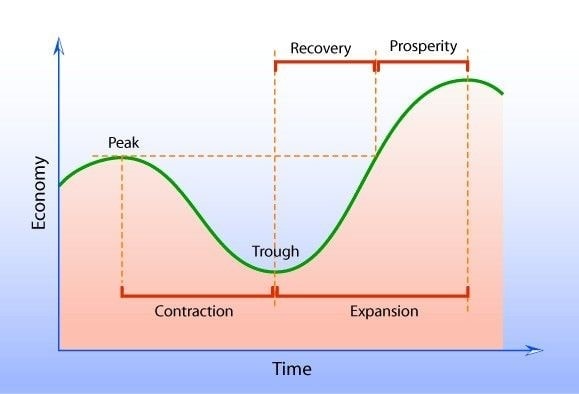
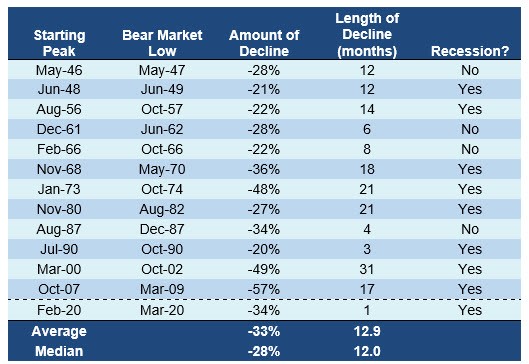
Bear markets are typically the result of a change in the economic cycle, as the economy shifts from expansion to contraction. Since World War II, the S&P 500 Index (U.S. large cap stocks) has experienced 13 bear markets, of which nine have coincided with a recession.
A bear market can be defined as either cyclical or secular. A cyclical bear market occurs when investor sentiment sours, resulting in a decline that lasts for weeks or months. In a secular bear market, the longer-term price trend is downward-sloping, with longer declines spelled by periodic rallies.

How often do bear markets occur, and how often do they typically last?
Bear markets vary in frequency, duration and severity. Since World War II, bear markets have, on average, occurred approximately every 5.7 years with a peak-to-trough decline of 33 percent spanning 13 months.

Source: ISI, Bloomberg, National Bureau of Economic Research, Haver Analytics, FMRCo (Asset Allocation Research Team).
Data based on S&P 500 Index price returns. Recessions are defined by the National Bureau of Economic Research.
What sets this bear market apart from others?
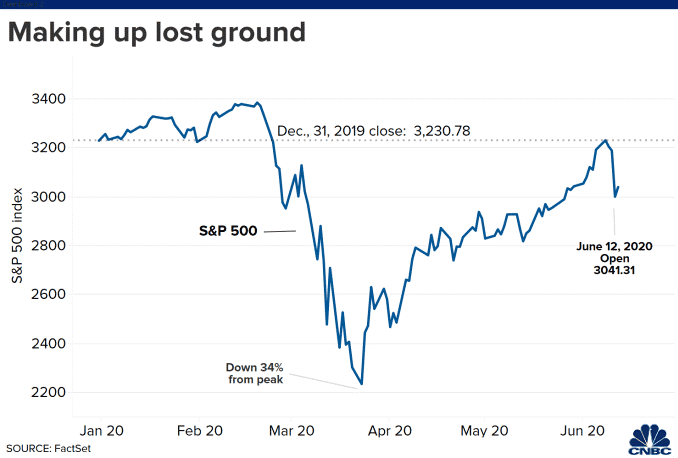
The S&P 500 Index transitioned from the longest-running bull market on record – at more than 11 years – to a bear market on March 12, with the index dropping more than 20 percent from its all-time high of 3,393 on February 19.
The speed at which markets fell and then subsequently recovered stands apart from past bear markets. Earlier this year, the S&P 500 Index set a new record for the fewest trading days needed to enter a bear market (only 16)1 versus a median of 116 trading days (since World War II).2 The S&P 500 Index’s 34 percent decline from February 19 to March 23 was relatively in line with past bear market declines, though the pullback occurred over a much shorter-than-normal timeframe – a little over a month versus a typical decline lasting nearly 13 months.
As pronounced as the February-to-March market pullback was, the subsequent rebound has been equally remarkable. The initial market recovery was driven largely by extraordinary fiscal and monetary stimulus. Over the past month, positive developments for several vaccine trials, optimism over a reopening of the economy and a better-than-anticipated jobs report have fueled further market gains. There is also mounting evidence that retail investors have piled into equities, pushing markets higher in recent weeks.
To put the recent rally into perspective, the S&P 500 Index gained 43 percent from the March 23 low through June 5, which represented the best 50-day advance since 1933.3 As of June 5, the S&P 500 Index was down merely 0.3 percent for the year and only 5 percent below its February 19 high.
1 Howard Silverblatt, Senior Index Analyst at S&P Dow Jones Indices
2 Dow Jones Market Data
3 Capital Group, RIMES, Standard & Poor’s
Markets pulled back sharply on Thursday, June 11, with the S&P 500 Index falling nearly 6 percent. What happened?
Reports over a recent rise in coronavirus infections and the Federal Reserve’s grim outlook for the U.S. economy led to a sharp one-day selloff across risk assets. The S&P 500 Index finished with its worst single-day decline since March 16 and ended with its sharpest weekly drop (-4.7 percent) since March 20. Interestingly, non-U.S. equities fared better than their U.S. counterparts over the past week, with the MSCI EAFE Index and MSCI Emerging Markets Index declining -4.2 percent and -1.5 percent, respectively. As of June 12, the S&P 500 Index is down 5 percent for the year and stands 10 percent below its February high.

How does the recent rally compare to historical averages?
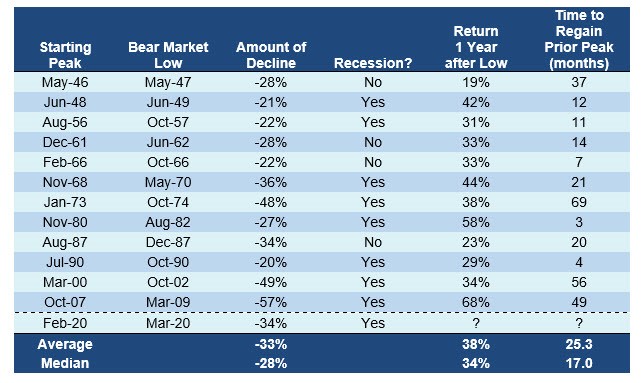
The most recent rebound (S&P 500 at +36 percent through June 12) spans less than three months and is thus well ahead of historical averages in terms of speed. Of the prior 12 bear markets since World War II, the average recovery was 38 percent one year after the market low, with the average time needed to eclipse the prior peak at 25 months.

Source: ISI, Bloomberg, National Bureau of Economic Research, Haver Analytics, FMRCo (Asset Allocation Research Team).
Data based on S&P 500 Index price returns. Recessions are defined by the National Bureau of Economic Research.
What important lessons can be learned from past bear markets?
Bear markets tend to be much shorter than bull markets. Over the past 70 years, the average bear market lasted 13 months while the average bull market ran for 72 months.3 While some investors may spend a lot of emotional energy worrying about the next pullback, the longer-term market trend is strongly positive.
Recognize the importance of maintaining a longer-term mindset and staying invested. Some of the market’s best days happen during periods of heightened uncertainty. Since 1950, 15 of the 20 best days for the S&P 500 Index occurred during a bear market (with four of those days recorded this past March).4 In looking at the most recent market rebound, the S&P 500 Index recovered +17.6 percent from March 24 to March 26, which represented its best three-day advance since 1933.1 Investors who ‘threw in the towel’ on March 23 would have missed out on a much needed bounce just days after the market low.
Avoid the impulse to chase performance. Investors who missed out on the recent rally may be tempted to ‘double down’ in an effort to play catch-up, but should instead design a plan to gradually invest back into the market over a series of tranches.
Revisit longer-term objectives and the risks being taken to achieve such goals. Bear markets can be instructive in assessing an investor’s true risk tolerance. During periods of sustained market gains, investors may overestimate the ability to withstand market volatility.
How should investors be positioned going forward?
While some recently released economic data was better than expected, the challenges presented by the COVID-19 pandemic are profound, with the global economy possibly needing years to fully recover. Market volatility, as measured by the CBOE Volatility Index, has fallen sharply over the past several months, but could certainly rise depending on future economic and COVID-related developments. Investors should not be lulled into complacency over market risk in light of the significant market rally. MPS LORIA continues to emphasize that investors should adhere to a prudently designed investment plan that aligns with longer-term objectives, risk tolerance and time horizon.
For more information, please contact any of the professionals at MPS LORIA Financial Planners, LLC.
Disclaimer: Values are for illustrative purposes only and do not guarantee current or future values. This and/or the accompanying information was prepared by or obtained from sources that MPS LORIA Financial Planners, LLC believes to be reliable, but does not guarantee its accuracy. This has been prepared manually from client records. No party has certified this is correct. It has been assembled to provide a best look into the history of the account. For actual history each individual investment company would need to be contacted to provide such information.
All advice is offered through: MPS LORIA Financial Planners, LLC, a registered investment advisory firm. Securities offered through: LORIA Financial Group, LLC, a registered broker dealer; member FINRA & SIPC. Please read all investment material carefully before any investing. It is important to consider all objectives, risks, costs and liquidity needs before investing. Please contact an investment professional for a copy of any investment’s most recent prospectus. MPS LORIA Financial Planners, LLC and LORIA Financial Group, LLC do not provide tax or legal advice. All information provided is for informational purposes and it is at the sole discretion of the client on how or if they proceed with any implementation of such information. As it pertains to tax or legal topics the client must discuss with their CPA or attorney before proceeding. MPS LORIA Financial Planners, LLC nor any of its affiliates, members, directors or employees can be held responsible for use of information provided. While reasonable efforts are made, information provided is not guaranteed to be accurate. This report is intended for the exclusive use of clients or prospective clients of MPS LORIA Financial Planners, L.L.C. Content is privileged and confidential. Dissemination or distribution is strictly prohibited. Visit www.cefex.org for more information on MPS LORIA’s CEFEX certification.
